

This project exemplifies a exploration of data refinement and predictive modeling using MATLAB's supervised machine learning capabilities, with a focus on addressing societal concerns surrounding sustainability and climate change. By delving into preprocessing techniques to handle data inconsistencies from Kaggle and retaining outliers for robust analysis, the endeavor underscores a commitment to reduce uncertainty. Through the strategic application of diverse machine learning models, including Coarse Tree, Robust Linear, and Fine Gaussian SVM, this project aims to elucidate nuanced insights on temperature fluctuations over time.
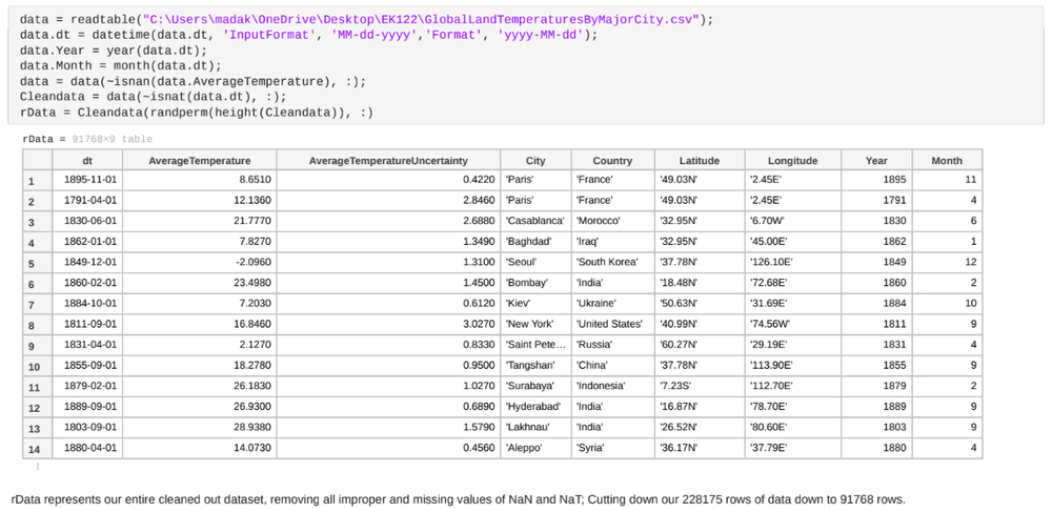
In preprocessing the data for analysis, three crucial features were identified: 'dt' (date), 'AverageTemperature', and 'Latitude', pivotal for assessing temperature shifts due to global warming across various timeframes and regions. Addressing challenges posed by inconsistencies in date formats, including MM/DD/YYYY, YYYY-MMM-DD, and NaT, two approaches were considered: standardizing date formats and converting them to cell data types, or eliminating the 'dt' feature and introducing a 'Year' column. The decision to retain 4733 outliers in the dataset is grounded in their potential to reveal significant patterns or anomalies crucial for understanding real-world phenomena as such caused by climate change. By excluding outliers, originally from a dataset encompassing over a million rows of data, enhances the robustness of machine learning models and aligns with the principle of utilizing comprehensive datasets to avoid bias.

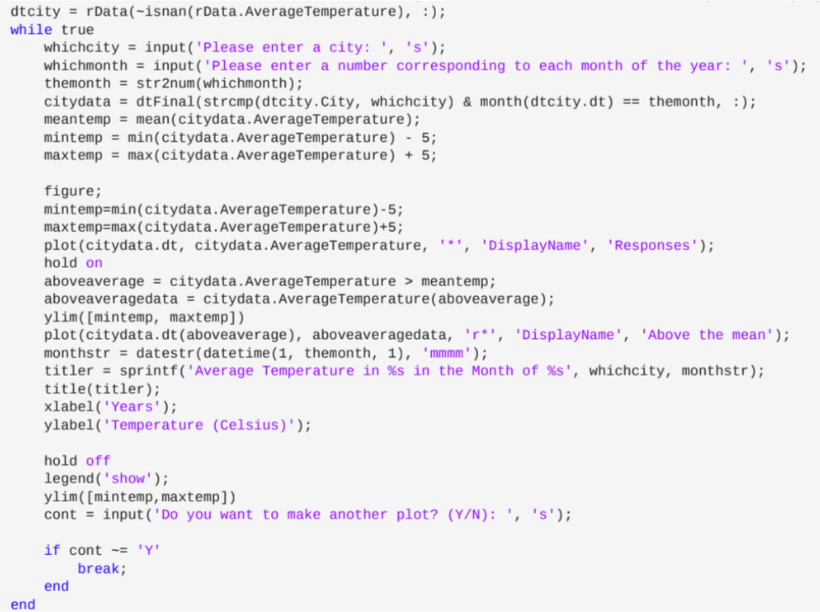
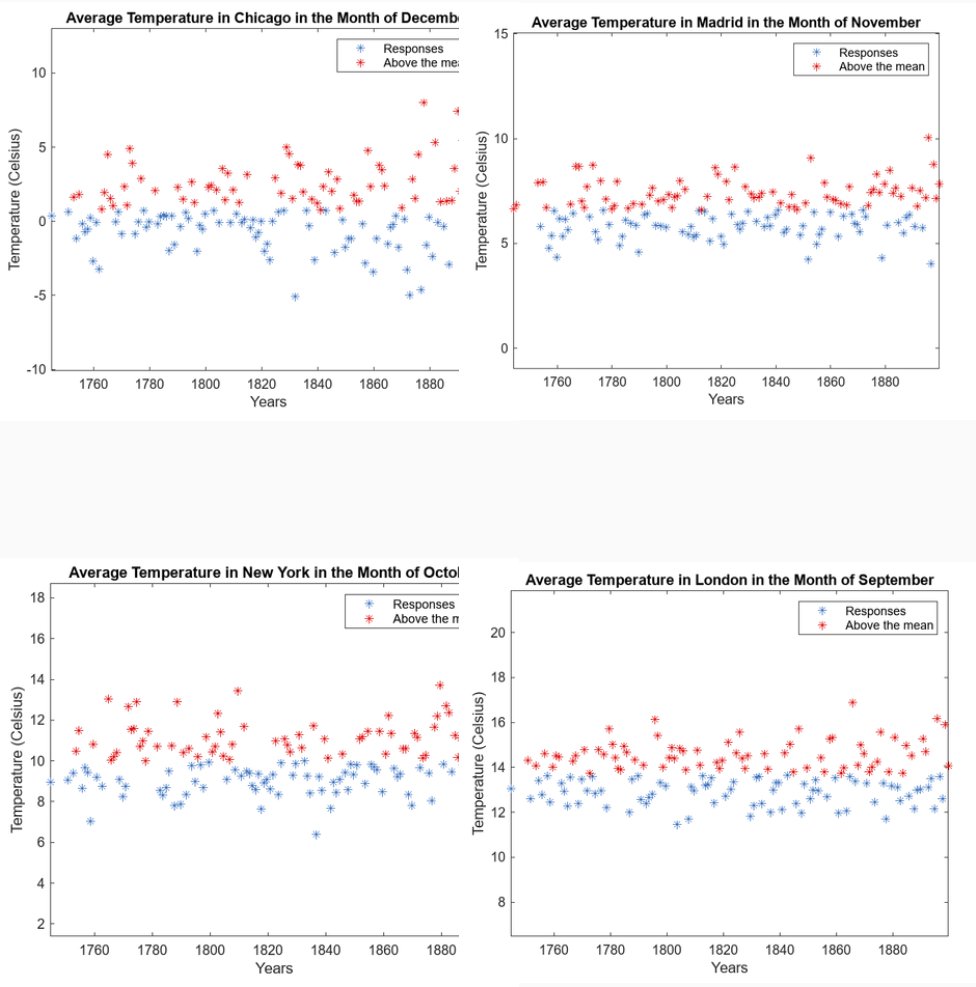
The provided MATLAB code utilizes a while loop to repeatedly prompt the user for a major city and a month expressed as a number from 1 to 12. For each input, the program plots the temperature data for the selected city in blue, highlighting data points exceeding the mean temperature in red. It employs string comparison functions to locate the inputted city within the dataset and extracts the corresponding temperature data for the specified month. The accompanying graphs exemplify a user-input interactive feature enabling users to visually compare the temperature variations of different countries across the globe against their respective average temperatures over centuries. This functionality facilitates a comprehensive and visual understanding of how temperatures fluctuate throughout the year and across geographical regions.


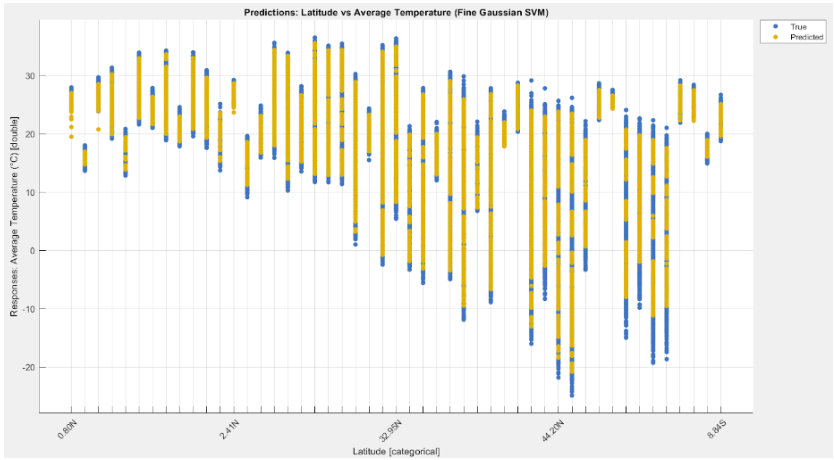
I decided to use the Regression Learner over the Classification Learner as I believe the objective with the dataset leans more towards numerical analysis and less categorical, thus aiming to quantitatively predict and understand the degree of increase in greenhouse gas emissions in time. I found that tree-based models, particularly the coarse tree model, outperformed linear regression approaches, indicating a nonlinear relationship between predictors and average temperature. The fine Gaussian model showed similar performance to the coarse tree model but provided a more nuanced view when considering monthly variations.
• The extensive training time required for the more complexed regression models like the Gaussian Process and Kernel Approximation models, significantly limited the number we could run. Similarly, for the plot and interpretation models other than "Response", "Predicted vs. Actual", and "Residuals", despite allocating hours for computation
• Preprocessing the data to meet the required formats for each feature when using the MATLAB apps, such as converting between categorical, numerical, or cell structured data
• How to classify and normalize large datasets in MATLAB
• Predict numbers using MATLAB’s Supervised Learning Tools
• Exploring built-in functions in MATLAB Library for machine learning
• File management, exportation and extraction of various data types
• Transferable Python and Data Analytics Skills
• AI Modeling Optimization & Analysis