

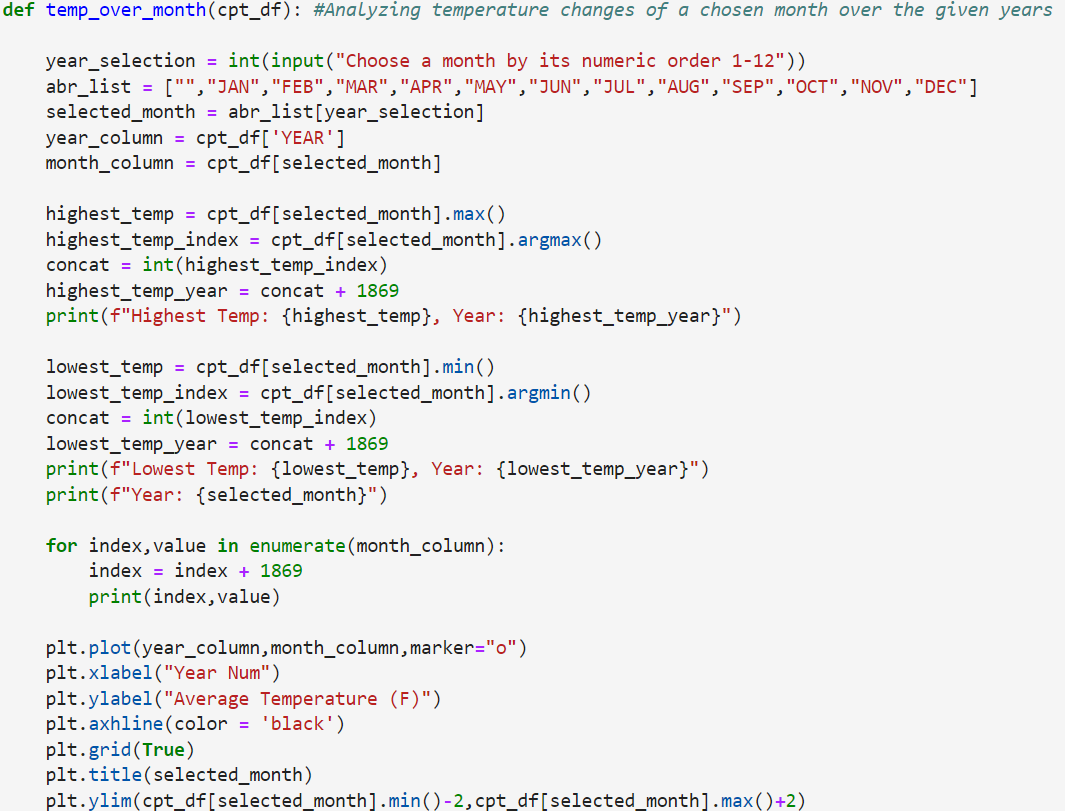
This final project is associated with EK121, Intro to Programming for Engineers. For our final project, our task was to choose a societal challenge that can be analyzed of its trajectory of the matter using an online online datasets and processing the data using python. Motivated by concerns about global warming, I decided to examine temperature changes and their environmental impact specifically analyzing the temperature of Central Park, NYC. For my script, I used the Pandas library to process my selected dataset as I felt it most feasible with my data set.
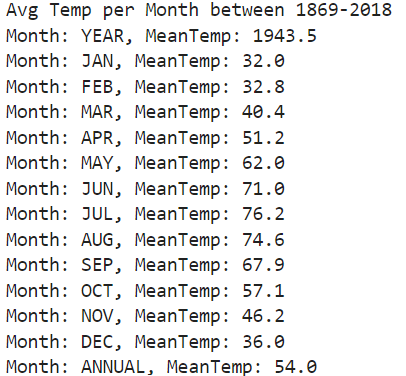
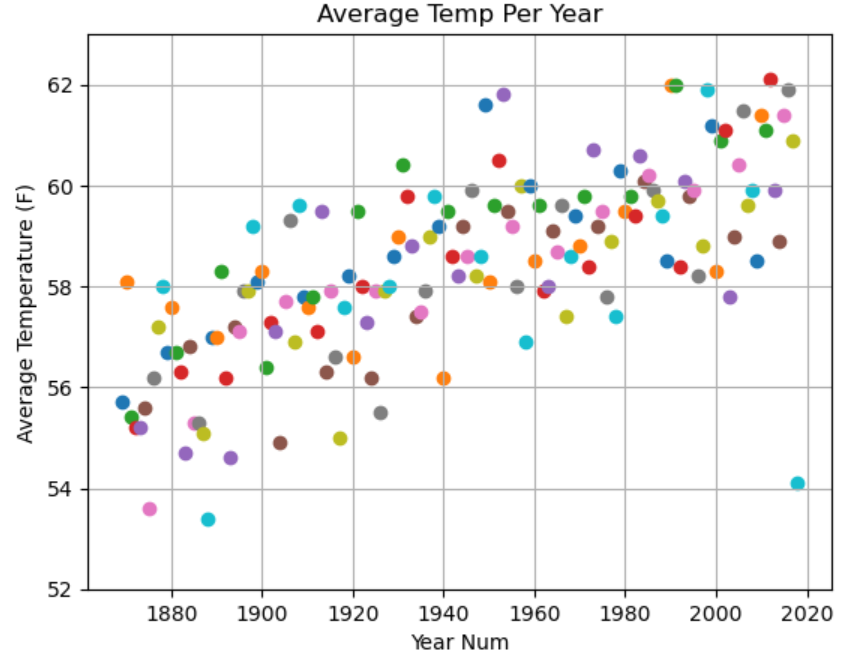
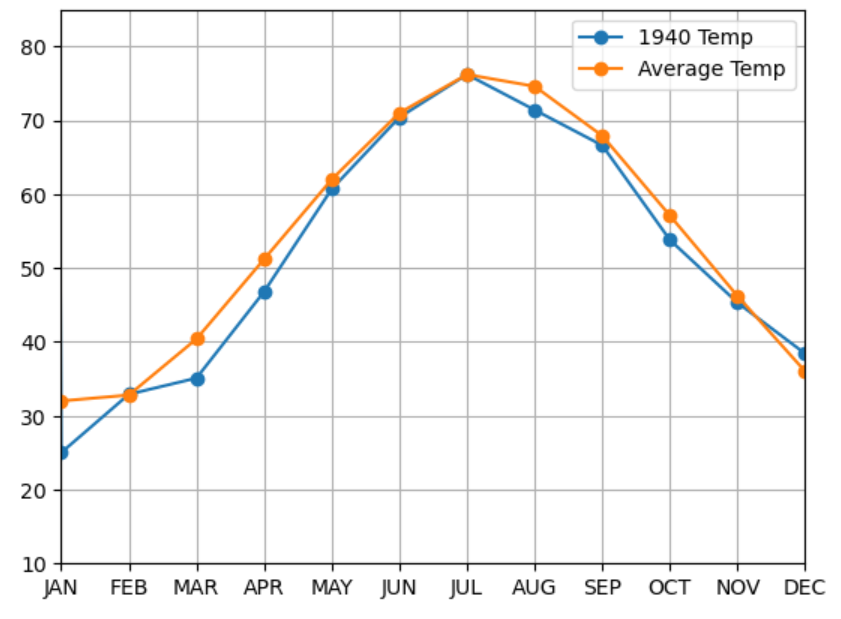
Three distinct approaches were devised, outlined in the image above: 1) comparing the average temperature of each month across all 150 years to the average temperature of each month in a chosen year; 2) examining the change in average temperature per year over the 150-year timeframe; and 3) assessing the temperature fluctuation of a specific month over the entire 150-year period. The script was developed with the primary objective of improving user experience through the incorporation of guided inputs, diverging from a mere presentation of self-analyzed data for passive reading. This helps to introduce greater versatility in terms of the date combinations users might want to compare. Slide =>
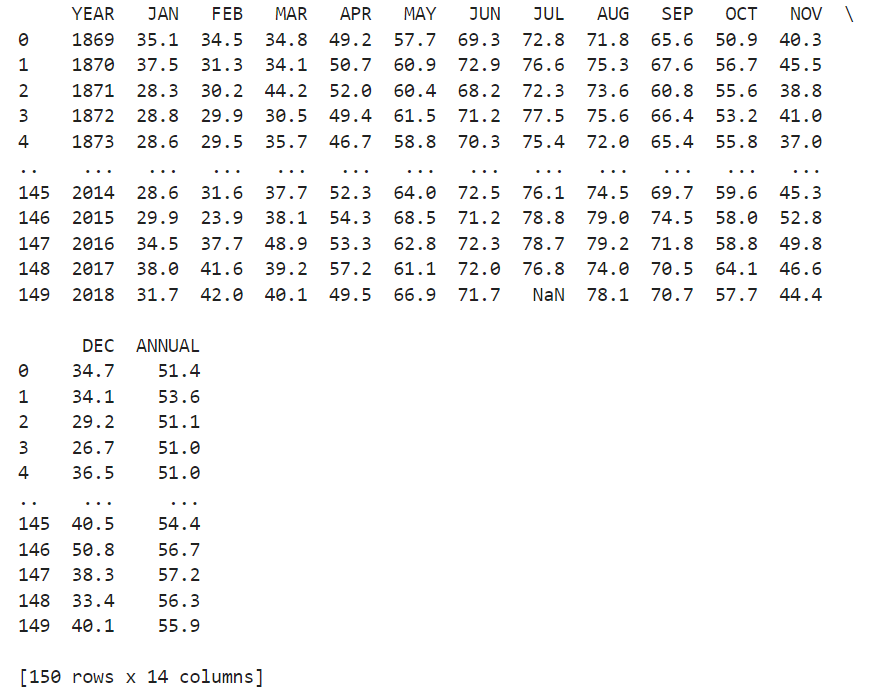
• Proper indexing using Pandas when displaying data into a table
• Conversion between numerical and categorical data
• How to reference strings from original dataset into desired labeled table
• Iterations through each column and row without targetting the table labels
• Comparisons of using NumPy arrays and Pandas library interchangeably for data entry and processing
• Understanding how to use numerical data to synthesize concurrent trends
• Finding more than one way to represent and visualize patterns using python
• Taking accountability of user responses to ensure code runs smoothly